This is the inaugural Bottomline Teardown — our recurring format that breaks down the unit economics of one specific business model in one specific sector. Today: a metro public CPO and a Tier 2 captive fleet depot, side by side. Numbers are constructed from publicly disclosed financial filings, RFP documentation, operator conversations, and our own modeling. Directionally accurate, not company-specific. Ranges reflect the realistic spread we've encountered.
Why this teardown matters
When two business models are compared in the press, they're almost always compared on outcome. Revenue, headcount, geography, valuation. Rarely on the unit-economic substrate that produces those outcomes.
For Indian EV infrastructure, this is the most consequential blind spot in the sector's narrative. A metro public CPO and a Tier 2 captive fleet depot use overlapping equipment and overlapping vocabulary. They look like the same business. They are not.
This teardown shows you why.
Setting up the comparison
We'll compare two single-site economic units, modeled as standalone profit centers — ignoring overhead allocation and corporate G&A for clarity.
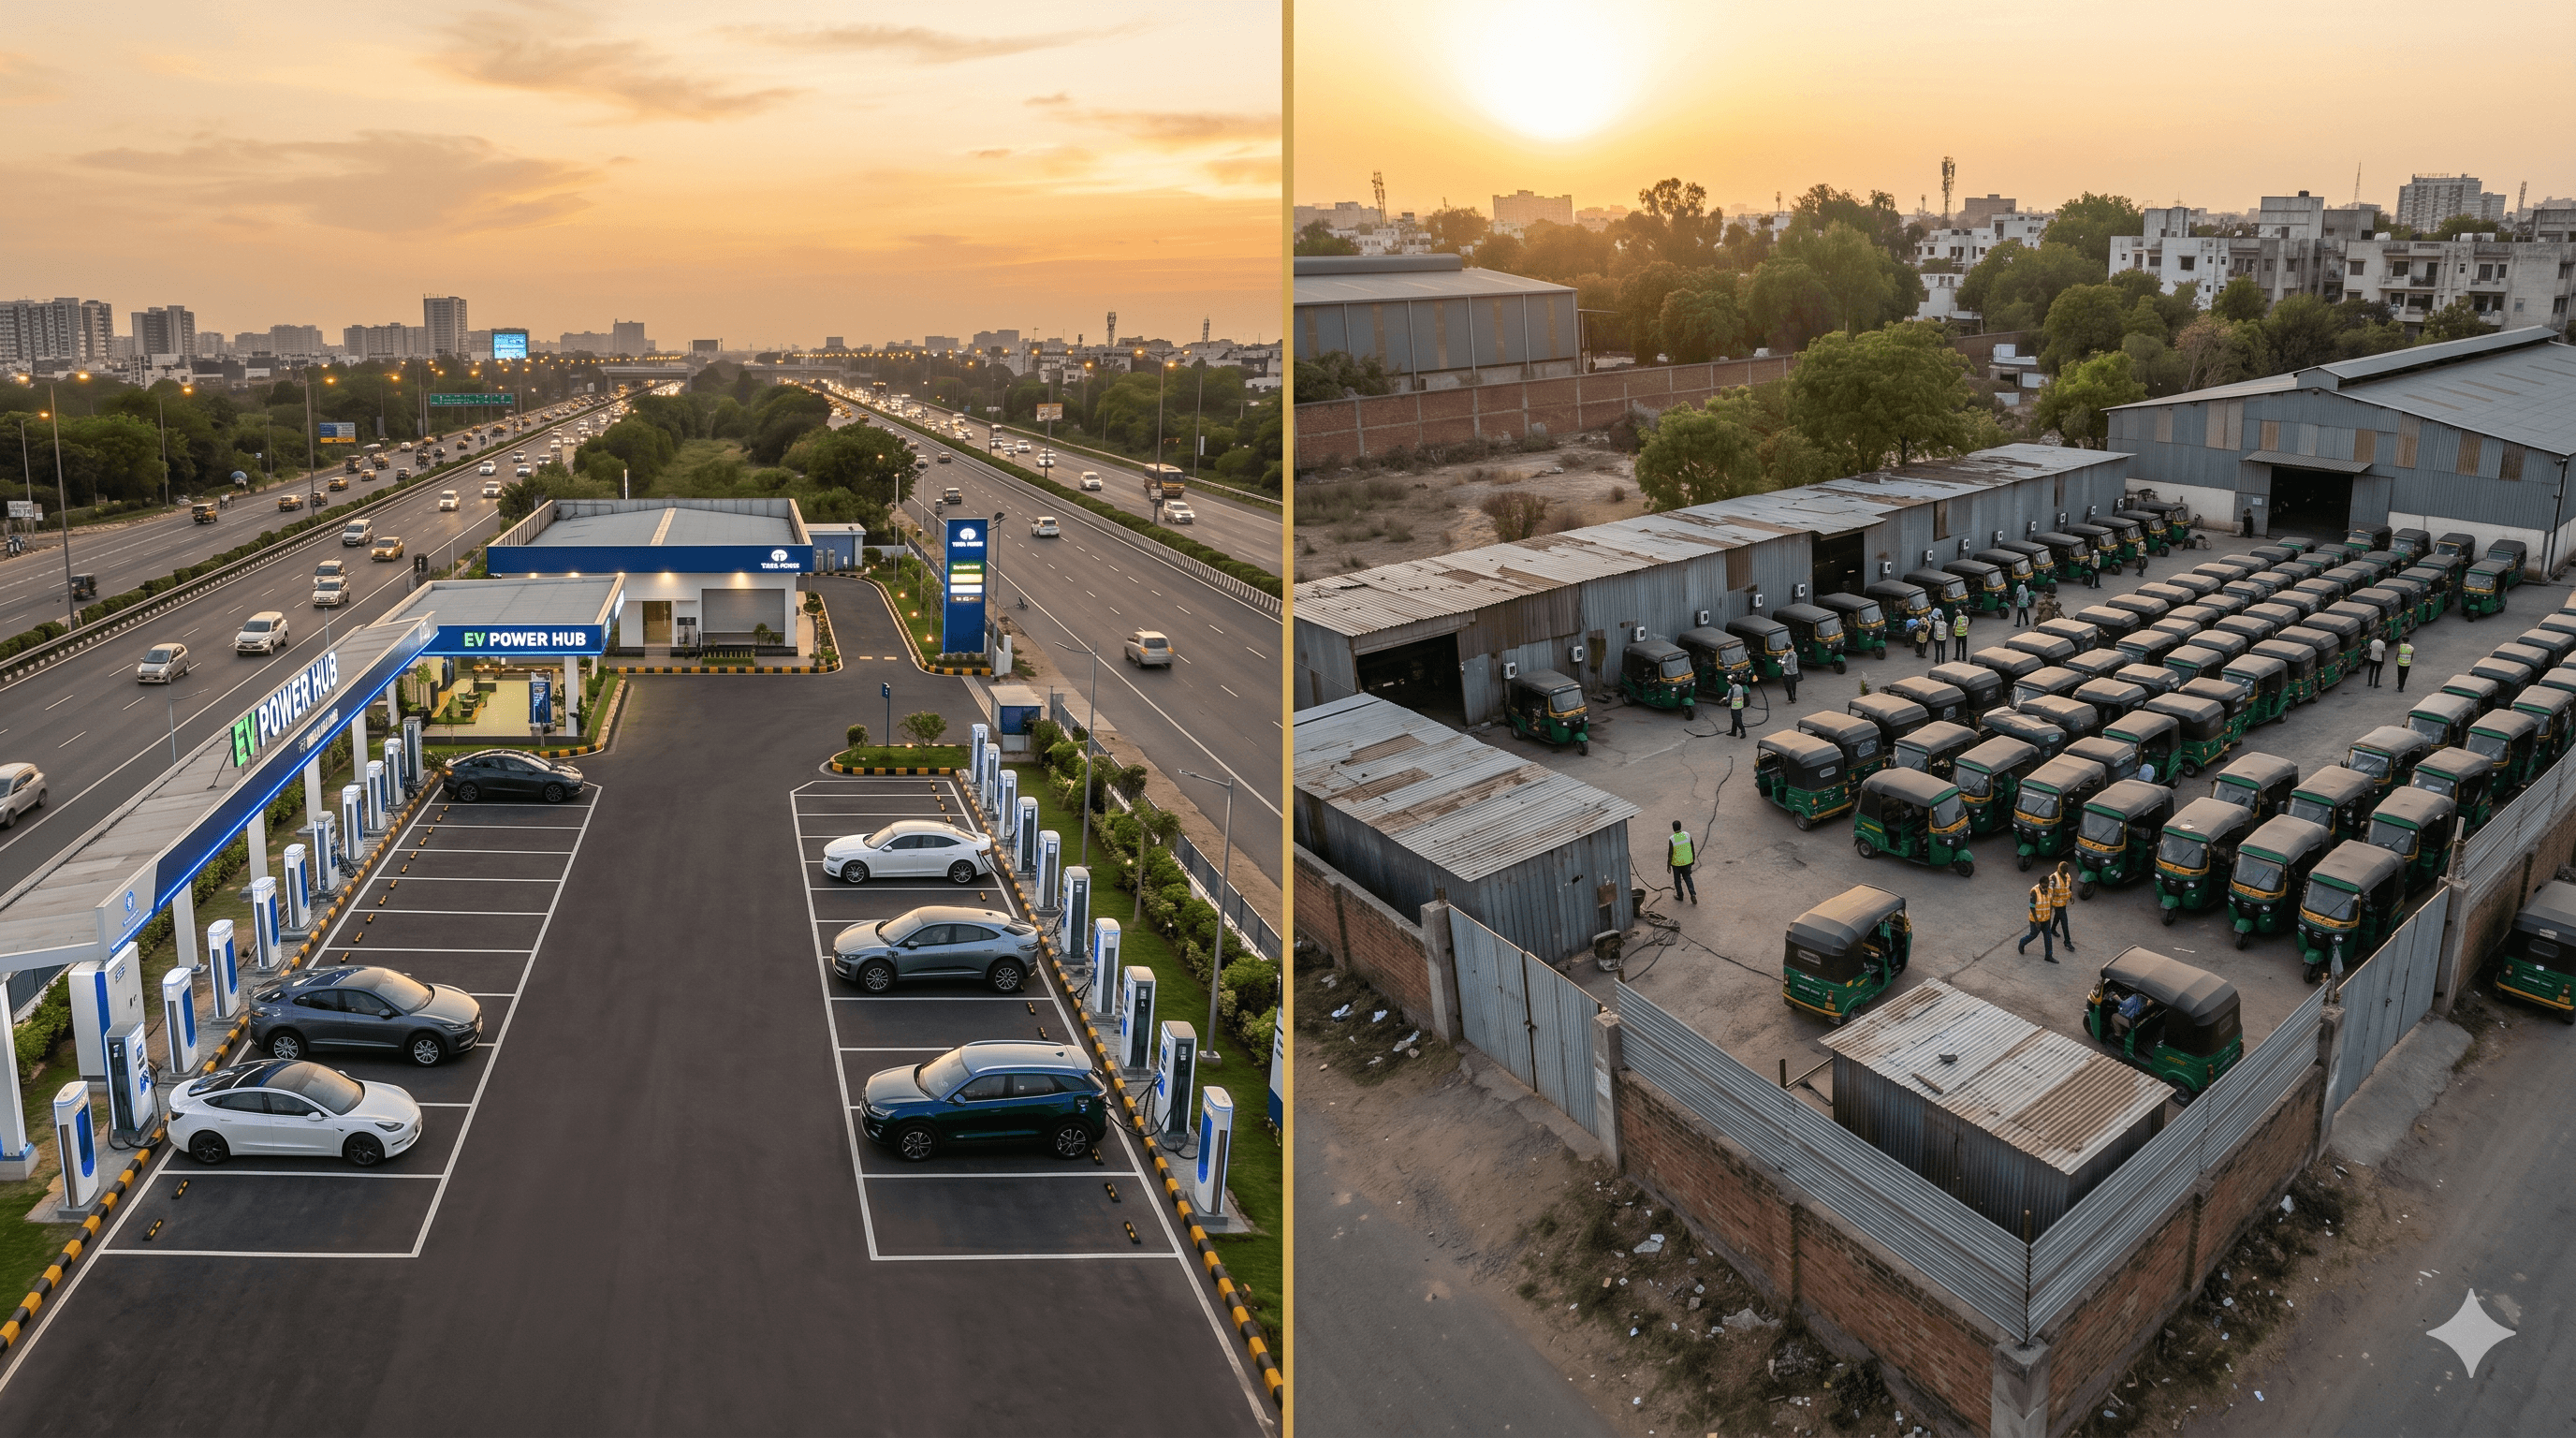
Site A — Metro Public CPO Fast-Charging Hub. Tier 1 metro location (Bangalore, Mumbai, Delhi NCR). 4 × 60 kW DC fast chargers + 4 × 22 kW AC chargers, at a highway-adjacent fuel station forecourt or premium mall parking. Customer: mostly private 4-wheeler EV owners, with 10–15% from app-based aggregators. Operator examples: Tata Power EZ Charge, Statiq, ChargeZone, Jio-bp Pulse.
Site B — Tier 2 Captive Fleet Depot. Coimbatore/Madurai/Vizag industrial estate. 8 × 22 kW AC chargers or 6 × battery swap docks, on operator-owned depot land behind a compound wall, on a negotiated DISCOM tariff. Customer: a 60-vehicle 3-wheeler fleet running goods or passenger logistics; secondary access for partner fleets. Operator examples: local fleet operators with 50–200 vehicles, typically founded by ex-OEM or ex-logistics executives.
Both sites are 18–24 months operational. Both are real categories with multiple Indian companies in them today.
The capex stack
The first surprise is in the equipment cost. Most people overestimate the equipment differential and underestimate the civil and grid differential.
Bottomline Teardown · EV-P3 · Capex breakdown
What it costs to build each site
Ranges reflect realistic spread from operator conversations and public filings · ₹ lakhs
Site A — Metro Public CPO
4 × 60 kW DC fast chargers
4 × 22 kW AC chargers
Civil works (canopy, signage, lighting)
Grid connection + transformer upgrade
Software stack (CMS, OCPP, payments)
Land development and legal
Total capex
₹135L
range ₹111–163L
Site B — Tier 2 Captive Fleet Depot
8 × 22 kW AC chargers or 6 swap docks
Civil works (basic shed, drainage)
Grid connection + transformer
Software (billing, telemetry, fleet)
Land — operator-owned
Total capex
₹35L
range ₹22–48L
Site A is 3–4× the capex of Site B for nominally similar kWh throughput capacity. The differential is not the chargers — it is civil works, premium siting, transformer surprises, and rented land.
Constructed from operator conversations, RFP filings, and PBV modeling · Jun 2026
The first thing that jumps out: Site A is 3–4× the capex of Site B for nominally similar charging capacity in kWh-throughput-per-day terms. The differential isn't the chargers — it's everything else: branded civil works, premium siting, transformer surprises, and rented land.
The revenue side
This is where the comparison really separates.
Site A — Metro Public CPO: 192 charger-hours available per day. Realistic utilization: 8–12%. Average session: 1.2 hours, 35 kWh delivered (DC fast charging dominant). Tariff: ₹18–22/kWh blended. Daily revenue at 10% utilization: ₹13,000–17,000. Annual revenue: ₹48–60 lakhs.
Site B — Tier 2 Captive Fleet Depot: 192 charger-hours available per day. Realistic utilization: 35–45% — because the fleet runs vehicles through it on a known schedule. Average session: 2–3 hours, 12 kWh delivered (AC charging for 3W). Effective tariff: ₹9–14/kWh. Daily revenue at 40% utilization: ₹13,000–18,000. Annual revenue: ₹48–66 lakhs.
The second thing that jumps out: both sites generate roughly comparable annual revenue despite Site B having one-third the capex. The reason is utilization. Site B trades a lower price-per-kWh for vastly higher utilization. The product — total kWh sold annually — is similar.
The cost side
Revenue is half the picture. Costs are where the gap really opens.
- **Site A annual opex — ₹49–72 lakhs**: electricity ₹35–45L (≈70% of revenue), software/payments/support ₹3–5L, maintenance ₹3–5L, site rental or revenue share ₹3–8L, marketing and CAC ₹2–4L, overhead ₹3–5L.
- **Site B annual opex — ₹25–38 lakhs**: electricity ₹22–32L (lower via negotiated industrial tariffs), software ₹0.5–1L, maintenance ₹2–3L, land rental ₹0 (operator-owned), marketing and CAC ₹0 (captive customer), overhead ₹1–2L.
Site A is operating at roughly break-even to mildly negative EBITDA at 10% utilization. It is not paying down its capex stack at all. The published losses of major public CPOs are real, and they are explained by exactly this math.
Site B operates at 15–35% EBITDA margins on similar topline revenue. Capex pays back in 3–5 years even on conservative assumptions — and that's before counting any operating-leverage benefit from running additional fleets through the same depot.
The payback period — the punchline
Bottomline Teardown · EV-P3 · The verdict
Metro CPO vs Tier 2 depot — side by side
Metric
Site A — Metro CPO
Site B — Tier 2 Depot
Capex
~₹135L
range ₹111–163L
~₹35L
range ₹22–48L
Annual EBITDA
−₹10 to +₹3L
near break-even to loss
₹10–₹25L
15–35% margin
Simple payback
25+ years
effectively never at current utilization
2–4 years
conservative assumptions
5-year IRR
Negative
capital destruction at 8–12% utilization
18–35%
strong positive return
Same revenue. One-third the capex. The difference in EBITDA and payback is not noise — it is the structural reality of utilization-led vs capex-led infrastructure economics.
These are not hypotheticals. They are the directional shape of the math you'll see when you sit down with operators and run the spreadsheets.
What this means for the sector
Three implications.
1. The published losses of major public CPOs are not a temporary burn-while-we-scale phase. They are structural. At current utilization levels, the math doesn't get to break-even with more time. It gets there with much higher utilization — which requires private 4W EV penetration crossing 15–20% nationally, or aggregator-fleet adoption of public charging spiking dramatically. Neither is happening on a 24-month horizon. The CPOs who survive will either be subsidized by parent corporations with strategic reasons to absorb losses, or will pivot toward fleet-captive models.
2. The winners in the next 24 months are the small Tier 2 operators most VCs have never met. A 60-vehicle fleet operator running their own depot in Coimbatore, generating ₹15–25 lakhs of EBITDA on ₹35 lakhs of capex, is the durable economic unit in this sector. They scale linearly with fleet size, not exponentially. They look 'small' by VC growth standards. They are real businesses with positive ROIC. Aggregate 50 of them, or build a software and financing layer that serves them, and you have a serious company.
3. The cheque-size implication for ₹1 Cr funds is sharp. Site A capex is too high to be funded by a ₹1 Cr cheque — building 5–10 metro CPO sites needs ₹7–15 Cr minimum, which is a different fund's cheque. Site B capex, and especially the multi-site or software-layer business that aggregates Site B operators, is exactly in the zone where a ₹1 Cr cheque from a fund like Prime Bottomline Ventures matters.
What we're watching
- Tata Power's quarterly disclosures through FY27 — are they reporting EZ Charge unit-level economics, or only headline volume?
- Statiq's funding trajectory — they've raised significant capital; can they deliver utilization growth that matches?
- Battery Smart's expansion patterns — they're betting on Tier 2; their swap utilization data, if disclosed, would settle a lot of debates
- Magenta Mobility's reported depot economics — they straddle metro and Tier 2 fleet operations and have been more transparent than most
What could prove this teardown wrong
- If a metro CPO consortium strikes guaranteed-volume charging contracts with Indian aggregators (Uber, Ola, Rapido), Site A utilization could rise to 25%+ and the math reshapes
- If state-level subsidy schemes shift to reimbursing public CPOs on a per-session rather than per-installation basis, the operating margin gap narrows
- If land costs in Tier 2 industrial clusters rise faster than modeled — already visible in Surat — the Site B advantage narrows
Methodology: numbers constructed from public financial filings of listed CPO operators, RFP documents from MoP and state EV cells, conversations with 4 operators in Coimbatore and Surat, and our own modeling. Directional, not company-specific. Real Site A and Site B numbers will vary by ±20%. The directional gap holds.